Use Case 3 - Flooding in Zuid-Holland#
1. Introduction#
The focus of this use case is adaptation under uncertainty in interdependent Critical Infrastructure. This use case is most relevant for electricity distribution network operators.
Using pluvial flood data for South Holland, in the Netherlands, we estimate the disruptions on medium-low voltage substations, considering a set number of repair crews to carry out repairs on broken down substations. We availability of the road network is used to determine whether a substation can be reached.
Note
In this Use Case, hazard, exposure, population, and land use data cover a large area leading to very heavy files. Therefore, in this notebook a sample of the data is provided instead.
2. Directory structure#
# Set up configuration
config = get_development_config() #get_config() gets parameters directly from config.py in root, development config uses sample data
setup_dev_directories(config, remove_cache=True)
HAZARD_EXTRACTION_METHOD = config['analysis_config']['hazard_extraction_method']

# Configure simulation parameters from config
simulation_params = get_simulation_params(config)
accessibility_model = None
simulation_params['accessibility_model'] = accessibility_model

print(f"\nSimulation configuration:")
for key, value in simulation_params.items():
    if key != 'config':  # Don't print the entire config
        print(f"  {key}: {value}")

print(f"\nDirectory structure:")
print(f"  Interim: {config['interim_dir']}")
print(f"  Output: {config['output_dir']}")
print(f"  Cache will be organized by hazard directory: {Path(config['hazard_dir']).name}")

config['simulation_config']['major_timestep'] = 24
config['simulation_config']['verbose'] = False
max_days = None

caches = load_simulation_caches(config['interim_dir'], config['hazard_dir'])
print(f"Loaded caches: {[k for k in caches.keys() if caches[k] is not None]}")

root_dir = Path(config['root_dir'])
study_area_path = root_dir / 'data' / 'utilities' / 'stedin_area.geojson'
land_use_path = root_dir / 'data' / 'land_use' / 'CBS_Publicatiebestand_BBG2017_v1_sample.gpkg'
population_data_path = root_dir / "data" / "population" / "cbs_vk100_2024_v1_sample.gpkg"

print(f"WARNING! Values of lost load should be calculated with country-wide VOLL rates, not sample data!")

# Cache path for asset_to_lu (the complete pre-computed lookup)
asset_to_lu_cache_path = config['interim_dir'] / f"{land_use_path.stem}_asset_to_lu.pkl"
Created directories: c:\repos\UC3\data\interim\interim_test_hazard_timesteps, c:\repos\UC3\data\output\output_test_hazard_timesteps

Simulation configuration:
  flood_threshold: 0.2
  number_repair_crews: 5
  repair_crew_assignment_method: islands
  verbose: True
  recovery_parameters: {'repair_time_coefficients': [702.72, 3.14, 1.9891], 'damage_ratio_coefficients': (0.0468, 0.0077), 'damage_threshold': 0.01, 'repair_threshold': 2.0}
  accessibility_model: None

Directory structure:
  Interim: c:\repos\UC3\data\interim\interim_test_hazard_timesteps
  Output: c:\repos\UC3\data\output\output_test_hazard_timesteps
  Cache will be organized by hazard directory: test_hazard_timesteps
Loading simulation caches...
No accessibility cache found at c:\repos\UC3\data\interim\interim_test_hazard_timesteps\accessibility_cache_test_hazard_timesteps.pkl
No hazard extraction cache found at c:\repos\UC3\data\interim\interim_test_hazard_timesteps\hazard_extraction_cache_test_hazard_timesteps.pkl
No island cache found at c:\repos\UC3\data\interim\interim_test_hazard_timesteps\island_cache_test_hazard_timesteps.pkl
Loaded caches: ['accessibility_cache', 'hazard_extraction_cache', 'overlap_cache', 'island_cache']
WARNING! Values of lost load should be calculated with country-wide VOLL rates, not sample data!
3. Hazard characterisation#
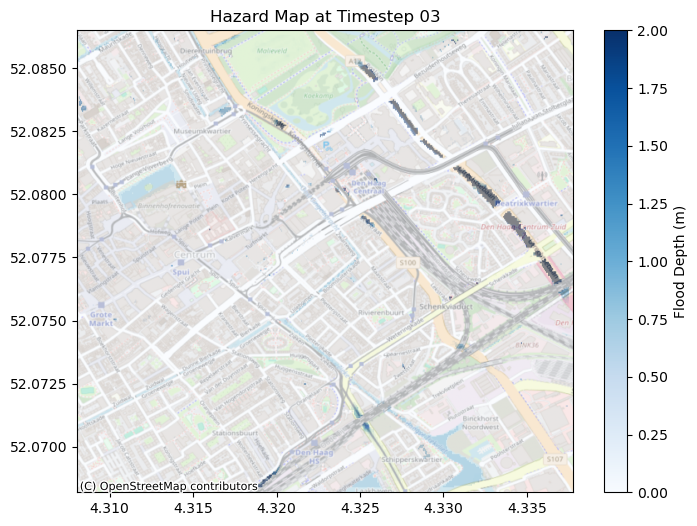
Pluvial flooding
The flood considered in this Use Case is produced by excess rainfall. To produce this data, the assumption of 200 mm of rainfall on previously wet soil over the whole province of South Holland, the Netherlands, was considered.
The data consists of time-explicit flooding depth maps at a daily timestep. The aggregated flood maps for this model can be found in the Open Data Portal of Zuid Holland: https://opendata.zuid-holland.nl/geonetwork/srv/api/records/6cb97102-f3b3-421e-a37e-c90615118e6d
While this case considers a single hazard type (pluvial flooding), it looks into consecutive days of flooding with the cascading effects of disrupted roads on the electricity network repairs.
hazard_maps = load_hazard_maps(config['hazard_dir'], max_days=None)
hazard_map_03 = hazard_maps[3]
with rasterio.open(hazard_map_03) as src:
    hazard_data_03 = src.read(1)
    hazard_transform_03 = src.transform
    crs = src.crs

fig, ax = plt.subplots(figsize=(8, 6))
extent = plotting_extent(hazard_data_03, hazard_transform_03)
im = ax.imshow(hazard_data_03, cmap='Blues', vmax=2, extent=extent, origin='upper')
ax.set_title("Hazard Map at Timestep 03")
fig.colorbar(im, ax=ax, label="Flood Depth (m)")

# Set axis to Web Mercator for contextily
ax.set_xlim(extent[0], extent[1])
ax.set_ylim(extent[2], extent[3])
ax.set_aspect('auto')
ctx.add_basemap(ax, crs="EPSG:4326", source=ctx.providers.OpenStreetMap.Mapnik, zoom=15, alpha=0.5)
plt.show()
Found 10 hazard map files
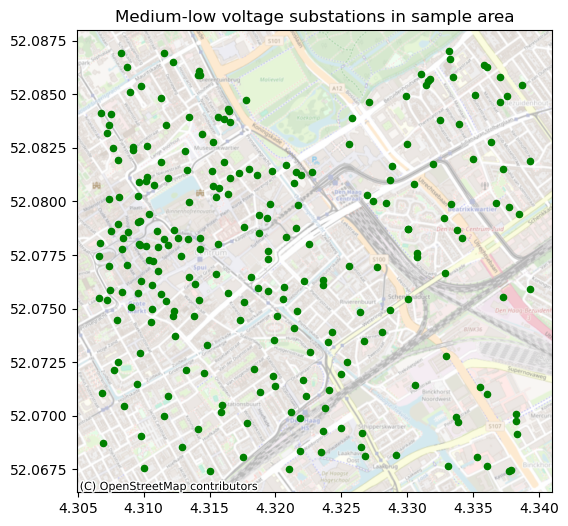
4. Exposure Assessment#
The electricity substation data is provided by Stedin, the local DSO, openly. The street data used is retrieved from OpenStreetMap.
gdf_assets = load_electricity_assets(config['electricity_dir'], asset_types=['msls'])
fig, ax = plt.subplots(figsize=(8, 6))
gdf_assets.centroid.to_crs(epsg=4326).plot(ax=ax, color='green', markersize=20)
ctx.add_basemap(ax, crs="EPSG:4326", source=ctx.providers.OpenStreetMap.Mapnik, zoom=15, alpha=0.5)
plt.title("Medium-low voltage substations in sample area")
plt.show()
Found 1 electricity station files matching types ['msls']
All .shp files in directory: ['ls_stations_test_samples.shp', 'msls_stations_test_samples.shp', 'ms_stations_test_samples.shp']
Files with 'station': ['ls_stations_test_samples.shp', 'msls_stations_test_samples.shp', 'ms_stations_test_samples.shp']
Final matched files: ['msls_stations_test_samples.shp']
Loading electricity assets from msls_stations_test_samples.shp
Loaded 245 msls assets
Combined total: 245 electricity assets
Asset types: {'msls': 245}
C:\Users\peregrin\AppData\Local\Temp\ipykernel_29288\2282920993.py:3: UserWarning: Geometry is in a geographic CRS. Results from 'centroid' are likely incorrect. Use 'GeoSeries.to_crs()' to re-project geometries to a projected CRS before this operation.

  gdf_assets.centroid.to_crs(epsg=4326).plot(ax=ax, color='green', markersize=20)
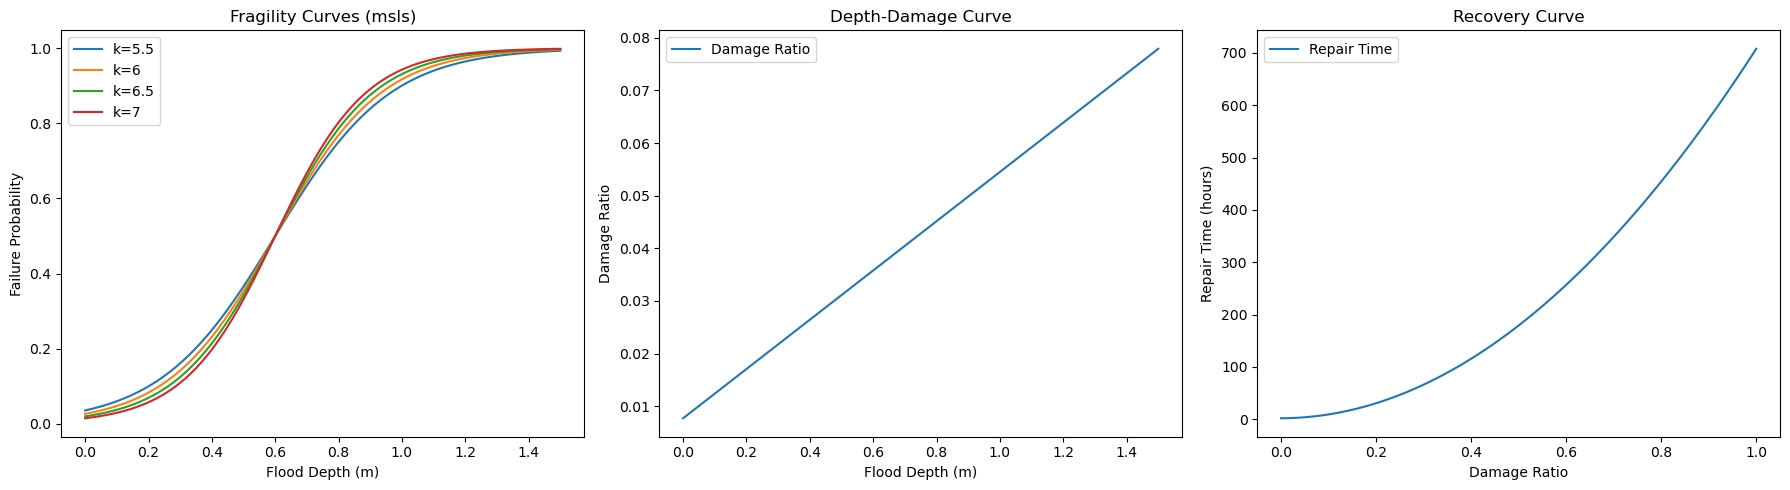
5. Vulnerability Assessment#
We estimate the damage to substations by intersecting the footprints of the substations with flooding depth data and taking the maximum value.
This value is then related to substation damage using a linearized depth-damage (vulnerability) curve (FEMA, 2003; Sánchez-Muñoz et al., 2020). Substation damage is expressed as a damage ratio between 0 (undamaged) and 1 (fully damaged). Finally, the damage ratio is used to estimate the repair time in hours through a repair time function (Movahednia et al., 2022 and Sánchez-Muñoz et al., 2020).
# Example coefficients for curves
damage_coeffs = simulation_params['recovery_parameters']['damage_ratio_coefficients']  # m, n for damage ratio
repair_coeffs = simulation_params['recovery_parameters']['repair_time_coefficients']  # a, b, c for repair time

hazard_depths = np.linspace(0, 1.5, 100)
damage_ratios = default_damage_ratio_function(hazard_depths, damage_coeffs)
damage_ratios = np.clip(damage_ratios, 0, 1)  # Ensure damage ratio does not exceed 1

# Recovery functions in range [0, 1]
damage_ratios_recovery = np.linspace(0, 1, 100)
repair_times = default_repair_time_function(damage_ratios_recovery, repair_coeffs)

# Fragility curves for different positive slopes
slopes = [5.5, 6, 6.5, 7]
fragility_curves = {
    k: 1 / (1 + np.exp(-k * (hazard_depths - 0.6)))
    for k in slopes
}

fig, axs = plt.subplots(1, 3, figsize=(18, 5))

# 1. Fragility curves with multiple slopes
for k, curve in fragility_curves.items():
    axs[0].plot(hazard_depths, curve, label=f'k={k}')
axs[0].set_title('Fragility Curves (msls)')
axs[0].set_xlabel('Flood Depth (m)')
axs[0].set_ylabel('Failure Probability')
axs[0].legend()

# 2. Depth-Damage curve
axs[1].plot(hazard_depths, damage_ratios, label='Damage Ratio')
axs[1].set_title('Depth-Damage Curve')
axs[1].set_xlabel('Flood Depth (m)')
axs[1].set_ylabel('Damage Ratio')
axs[1].legend()

# 3. Recovery curve in [0,1]
axs[2].plot(damage_ratios_recovery, repair_times, label='Repair Time')
axs[2].set_title('Recovery Curve')
axs[2].set_xlabel('Damage Ratio')
axs[2].set_ylabel('Repair Time (hours)')
axs[2].legend()

plt.tight_layout()
plt.show()
6. Risk Assessment#
The time-explicit breakdown and recovery simulation is done iteratively to explore the uncertainty space, with all the deterministic results (e.g. flood overlays, road isolations, etc) being computed once, and catched for future runs.
A single simulation is not enough#
The results from a single simulation give some indication of the stations that get flooded, the duration of the flood, and the extent of the damage. Here we set the slope of the fragility curve at 6.0, and assume there are 5 repair crews available for the area.
all_results, final_state, cache_updated = simulate_asset_damage_recovery_access_breakdown(
    gdf_assets,
    hazard_maps,
    number_repair_crews = 5,
    repair_crew_assignment_method = simulation_params['repair_crew_assignment_method'],
    flood_threshold = simulation_params['flood_threshold'],
    recovery_parameters = simulation_params['recovery_parameters'],
    root_dir = config['root_dir'],
    verbose = False,
    timestep_output=True,
    execution_id = "test_run_breakdown",
    config=config,
    major_timestep=config['simulation_config']['major_timestep'],
    accessibility_cache=caches.get('accessibility_cache', None),
    hazard_extraction_cache=caches.get('hazard_extraction_cache', None),
    overlap_cache=caches.get('overlap_cache', None),
    island_cache=caches.get('island_cache', None),
    fragility_param_k=6.0
)
print(f"\nSimulation completed. Cache updated")
Identified 16 boundary assets out of 245 total assets.
Extracting hazard values using method: max
Saved hazard extraction cache: 1 entries to c:\repos\UC3\data\interim\interim_test_hazard_timesteps\hazard_extraction_cache_test_hazard_timesteps.pkl
Cached hazard extraction results for map 0 from GHG_timesteps_test0.tif
Cache miss for island_assignment_EV0_ma_0.2_n245_ffb9075134a2efe7ad5cdcebb95eef31, computing islands on the fly...
Loading hazard graph from c:\repos\UC3\data\test_samples\static\output_graph\base_graph_hazard_editted.p
Saved island cache: 1 entries to c:\repos\UC3\data\interim\interim_test_hazard_timesteps\island_cache_test_hazard_timesteps.pkl
Successfully computed and cached islands for island_assignment_EV0_ma_0.2_n245_ffb9075134a2efe7ad5cdcebb95eef31
Extracting hazard values using method: max
Saved hazard extraction cache: 2 entries to c:\repos\UC3\data\interim\interim_test_hazard_timesteps\hazard_extraction_cache_test_hazard_timesteps.pkl
Cached hazard extraction results for map 1 from GHG_timesteps_test1.tif
Cache miss for island_assignment_EV1_ma_0.2_n245_ffb9075134a2efe7ad5cdcebb95eef31, computing islands on the fly...
Loading hazard graph from c:\repos\UC3\data\test_samples\static\output_graph\base_graph_hazard_editted.p
Saved island cache: 2 entries to c:\repos\UC3\data\interim\interim_test_hazard_timesteps\island_cache_test_hazard_timesteps.pkl
Successfully computed and cached islands for island_assignment_EV1_ma_0.2_n245_ffb9075134a2efe7ad5cdcebb95eef31
Computing island lengths...
Saved overlap cache: 1 entries to c:\repos\UC3\data\interim\interim_test_hazard_timesteps\overlap_cache_test_hazard_timesteps.pkl
Extracting hazard values using method: max
Saved hazard extraction cache: 3 entries to c:\repos\UC3\data\interim\interim_test_hazard_timesteps\hazard_extraction_cache_test_hazard_timesteps.pkl
Cached hazard extraction results for map 2 from GHG_timesteps_test2.tif
Cache miss for island_assignment_EV2_ma_0.2_n245_ffb9075134a2efe7ad5cdcebb95eef31, computing islands on the fly...
Loading hazard graph from c:\repos\UC3\data\test_samples\static\output_graph\base_graph_hazard_editted.p
Saved island cache: 3 entries to c:\repos\UC3\data\interim\interim_test_hazard_timesteps\island_cache_test_hazard_timesteps.pkl
Successfully computed and cached islands for island_assignment_EV2_ma_0.2_n245_ffb9075134a2efe7ad5cdcebb95eef31
Computing island lengths...
Saved overlap cache: 2 entries to c:\repos\UC3\data\interim\interim_test_hazard_timesteps\overlap_cache_test_hazard_timesteps.pkl
Extracting hazard values using method: max
Saved hazard extraction cache: 4 entries to c:\repos\UC3\data\interim\interim_test_hazard_timesteps\hazard_extraction_cache_test_hazard_timesteps.pkl
Cached hazard extraction results for map 3 from GHG_timesteps_test3.tif
Cache miss for island_assignment_EV3_ma_0.2_n245_ffb9075134a2efe7ad5cdcebb95eef31, computing islands on the fly...
Loading hazard graph from c:\repos\UC3\data\test_samples\static\output_graph\base_graph_hazard_editted.p
Saved island cache: 4 entries to c:\repos\UC3\data\interim\interim_test_hazard_timesteps\island_cache_test_hazard_timesteps.pkl
Successfully computed and cached islands for island_assignment_EV3_ma_0.2_n245_ffb9075134a2efe7ad5cdcebb95eef31
Computing island lengths...
Saved overlap cache: 3 entries to c:\repos\UC3\data\interim\interim_test_hazard_timesteps\overlap_cache_test_hazard_timesteps.pkl
Extracting hazard values using method: max
Saved hazard extraction cache: 5 entries to c:\repos\UC3\data\interim\interim_test_hazard_timesteps\hazard_extraction_cache_test_hazard_timesteps.pkl
Cached hazard extraction results for map 4 from GHG_timesteps_test4.tif
Cache miss for island_assignment_EV4_ma_0.2_n245_ffb9075134a2efe7ad5cdcebb95eef31, computing islands on the fly...
Loading hazard graph from c:\repos\UC3\data\test_samples\static\output_graph\base_graph_hazard_editted.p
Saved island cache: 5 entries to c:\repos\UC3\data\interim\interim_test_hazard_timesteps\island_cache_test_hazard_timesteps.pkl
Successfully computed and cached islands for island_assignment_EV4_ma_0.2_n245_ffb9075134a2efe7ad5cdcebb95eef31
Computing island lengths...
Saved overlap cache: 4 entries to c:\repos\UC3\data\interim\interim_test_hazard_timesteps\overlap_cache_test_hazard_timesteps.pkl
Extracting hazard values using method: max
Saved hazard extraction cache: 6 entries to c:\repos\UC3\data\interim\interim_test_hazard_timesteps\hazard_extraction_cache_test_hazard_timesteps.pkl
Cached hazard extraction results for map 5 from GHG_timesteps_test5.tif
Cache miss for island_assignment_EV5_ma_0.2_n245_ffb9075134a2efe7ad5cdcebb95eef31, computing islands on the fly...
Loading hazard graph from c:\repos\UC3\data\test_samples\static\output_graph\base_graph_hazard_editted.p
Saved island cache: 6 entries to c:\repos\UC3\data\interim\interim_test_hazard_timesteps\island_cache_test_hazard_timesteps.pkl
Successfully computed and cached islands for island_assignment_EV5_ma_0.2_n245_ffb9075134a2efe7ad5cdcebb95eef31
Computing island lengths...
Saved overlap cache: 5 entries to c:\repos\UC3\data\interim\interim_test_hazard_timesteps\overlap_cache_test_hazard_timesteps.pkl
Extracting hazard values using method: max
Saved hazard extraction cache: 7 entries to c:\repos\UC3\data\interim\interim_test_hazard_timesteps\hazard_extraction_cache_test_hazard_timesteps.pkl
Cached hazard extraction results for map 6 from GHG_timesteps_test6.tif
Cache miss for island_assignment_EV6_ma_0.2_n245_ffb9075134a2efe7ad5cdcebb95eef31, computing islands on the fly...
Loading hazard graph from c:\repos\UC3\data\test_samples\static\output_graph\base_graph_hazard_editted.p
Saved island cache: 7 entries to c:\repos\UC3\data\interim\interim_test_hazard_timesteps\island_cache_test_hazard_timesteps.pkl
Successfully computed and cached islands for island_assignment_EV6_ma_0.2_n245_ffb9075134a2efe7ad5cdcebb95eef31
Computing island lengths...
Saved overlap cache: 6 entries to c:\repos\UC3\data\interim\interim_test_hazard_timesteps\overlap_cache_test_hazard_timesteps.pkl
Extracting hazard values using method: max
Saved hazard extraction cache: 8 entries to c:\repos\UC3\data\interim\interim_test_hazard_timesteps\hazard_extraction_cache_test_hazard_timesteps.pkl
Cached hazard extraction results for map 7 from GHG_timesteps_test7.tif
Cache miss for island_assignment_EV7_ma_0.2_n245_ffb9075134a2efe7ad5cdcebb95eef31, computing islands on the fly...
Loading hazard graph from c:\repos\UC3\data\test_samples\static\output_graph\base_graph_hazard_editted.p
Saved island cache: 8 entries to c:\repos\UC3\data\interim\interim_test_hazard_timesteps\island_cache_test_hazard_timesteps.pkl
Successfully computed and cached islands for island_assignment_EV7_ma_0.2_n245_ffb9075134a2efe7ad5cdcebb95eef31
Computing island lengths...
Saved overlap cache: 7 entries to c:\repos\UC3\data\interim\interim_test_hazard_timesteps\overlap_cache_test_hazard_timesteps.pkl
Extracting hazard values using method: max
Saved hazard extraction cache: 9 entries to c:\repos\UC3\data\interim\interim_test_hazard_timesteps\hazard_extraction_cache_test_hazard_timesteps.pkl
Cached hazard extraction results for map 8 from GHG_timesteps_test8.tif
Cache miss for island_assignment_EV8_ma_0.2_n245_ffb9075134a2efe7ad5cdcebb95eef31, computing islands on the fly...
Loading hazard graph from c:\repos\UC3\data\test_samples\static\output_graph\base_graph_hazard_editted.p
Saved island cache: 9 entries to c:\repos\UC3\data\interim\interim_test_hazard_timesteps\island_cache_test_hazard_timesteps.pkl
Successfully computed and cached islands for island_assignment_EV8_ma_0.2_n245_ffb9075134a2efe7ad5cdcebb95eef31
Computing island lengths...
Saved overlap cache: 8 entries to c:\repos\UC3\data\interim\interim_test_hazard_timesteps\overlap_cache_test_hazard_timesteps.pkl
Extracting hazard values using method: max
Saved hazard extraction cache: 10 entries to c:\repos\UC3\data\interim\interim_test_hazard_timesteps\hazard_extraction_cache_test_hazard_timesteps.pkl
Cached hazard extraction results for map 9 from GHG_timesteps_test9.tif
Cache miss for island_assignment_EV9_ma_0.2_n245_ffb9075134a2efe7ad5cdcebb95eef31, computing islands on the fly...
Loading hazard graph from c:\repos\UC3\data\test_samples\static\output_graph\base_graph_hazard_editted.p
Saved island cache: 10 entries to c:\repos\UC3\data\interim\interim_test_hazard_timesteps\island_cache_test_hazard_timesteps.pkl
Successfully computed and cached islands for island_assignment_EV9_ma_0.2_n245_ffb9075134a2efe7ad5cdcebb95eef31
Computing island lengths...
Saved overlap cache: 9 entries to c:\repos\UC3\data\interim\interim_test_hazard_timesteps\overlap_cache_test_hazard_timesteps.pkl

Simulation completed. Cache updated
results_df_x=pd.DataFrame(all_results[0][1])
print_simulation_summary(results_df_x, gdf_assets, config)
======================================================================
SIMULATION RESULTS SUMMARY
======================================================================
Total assets: 245
Simulation duration: 240 hours (10 days)
Final operational rate: 100.0%
Peak damaged assets: 6
Peak flooded assets: 6
Total crew assignments: 16

RECOVERY TIMELINE (Daily Summary)
========================================
Day 0: 100.0% operational, 0 flooded, 0 unreachable, 0 damaged.
Day 1: 98.8% operational, 5 flooded, 0 unreachable, 5 damaged.
Day 2: 98.8% operational, 6 flooded, 0 unreachable, 6 damaged.
Day 3: 98.8% operational, 5 flooded, 0 unreachable, 5 damaged.
Day 4: 99.6% operational, 2 flooded, 0 unreachable, 2 damaged.
Day 5: 99.6% operational, 2 flooded, 0 unreachable, 2 damaged.
Day 6: 100.0% operational, 0 flooded, 0 unreachable, 0 damaged.
Day 7: 100.0% operational, 0 flooded, 0 unreachable, 0 damaged.
Day 8: 100.0% operational, 0 flooded, 0 unreachable, 0 damaged.
Day 9: 100.0% operational, 0 flooded, 0 unreachable, 0 damaged.

======================================================================
REPAIR BACKLOG ANALYSIS
======================================================================
Hour | Flooded | Damaged | Crews | Backlog | Effective?
-------------------------------------------------------
 0.0 |     0.0 |     0.0 |   0.0 |     0.0 | No
24.0 |     5.0 |     5.0 |   0.0 |    14.7 | No
48.0 |     6.0 |     6.0 |   0.0 |    18.1 | No
72.0 |     5.0 |     6.0 |   1.0 |    17.1 | No
96.0 |     2.0 |     5.0 |   3.0 |    12.7 | No
120.0 |     2.0 |     2.0 |   0.0 |     6.6 | No
144.0 |     0.0 |     2.0 |   2.0 |     4.6 | Yes
168.0 |     0.0 |     0.0 |   0.0 |     0.0 | No
192.0 |     0.0 |     0.0 |   0.0 |     0.0 | No
216.0 |     0.0 |     0.0 |   0.0 |     0.0 | No

SUMMARY:
During flooding (120 hours): 0.1 crews assigned on average
During clear periods (120 hours): 0.1 crews assigned on average
Repair backlog: Start=0.0hrs, Peak=18.1hrs, End=0.0hrs
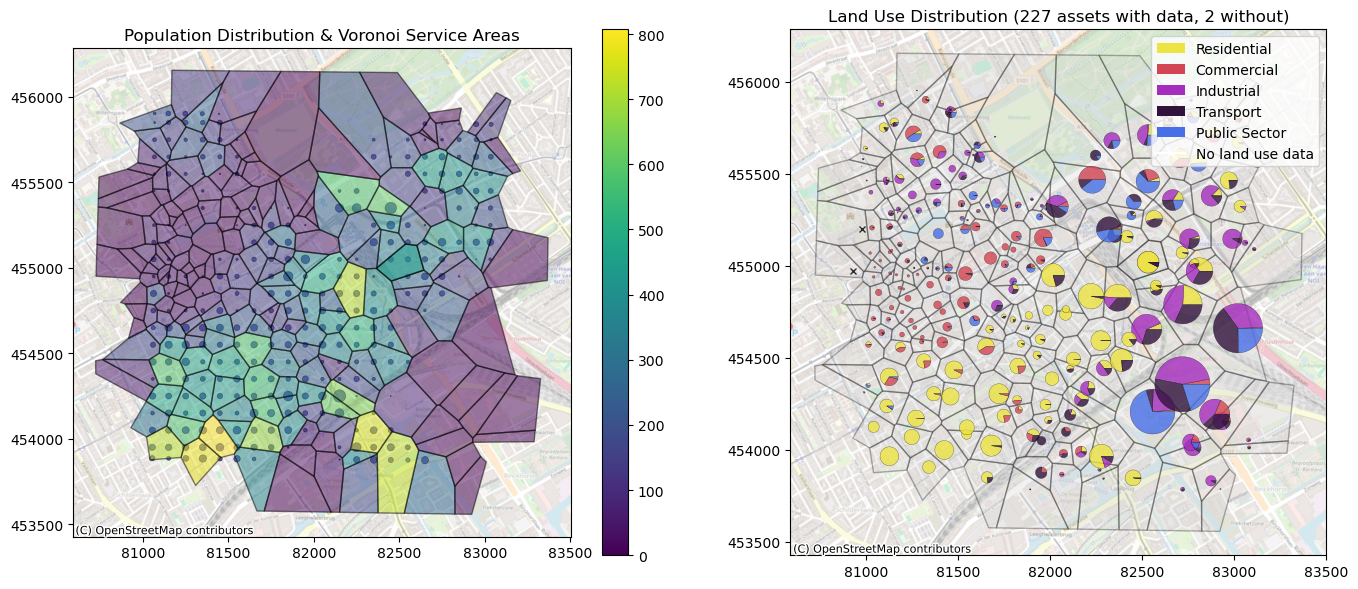
To understand the extent of the impact, it is necessary to map the population and the value of lost load to each substation. In other words, when a substation fails, it is necessary to understand how many people live in the area it services, and the economic activity that takes place in the area.
For that, population and land use information can be of use. The Central Bureau voor de Statistiek (CBS) of the Netherlands provides this information - https://www.cbs.nl/en-gb
First, the population data is mapped to service areas:
Note
In this notebook, a sample of the data is used. Please note that for monetary impacts to be relevant, the country-scale land use data should be used; when the country-scale data is used, this computation can take several minutes.
study_area = gpd.read_file(study_area_path, driver='GeoJSON').to_crs("EPSG:28992")

buffer_distance_meters = 1000
population_buffer = study_area.buffer(buffer_distance_meters)
population_buffer.set_crs("EPSG:28992")

# Create Voronoi polygons for service areas
print("Creating Voronoi polygons for service areas...")
voronoi_polygons_by_type = {}
for asset_type in gdf_assets['type'].unique():
    voronoi_gdf = create_voronoi_for_asset_type(
        gdf_assets,
        asset_type,
        boundary=study_area.geometry.unary_union
    )
    voronoi_polygons_by_type[asset_type] = voronoi_gdf

# Load and prepare population data
print("Loading population data...")
population_data = gpd.read_file(
    population_data_path,
    driver='GPKG',
    bbox=tuple(voronoi_gdf.total_bounds)
).to_crs("EPSG:28992")

# Filter out zero population and invalid geometries
population_data = population_data[
    (population_data['aantal_inwoners'] > 0) &
    (~population_data.geometry.isna())
].dropna(subset=['geometry'])

# Clip to study area
population_study_area = gpd.clip(population_data, population_buffer)
population_above_0 = population_study_area[['aantal_inwoners', 'geometry']].set_crs("EPSG:28992")

# Prepare population impact mapping
print("Preparing population impact data...")
asset_population_map = prepare_population_impact_data(
    population_data=population_above_0,
    voronoi_gdf=voronoi_polygons_by_type['msls']
)
print(f"Population data prepared for {len(asset_population_map)} assets")

voronoi_gdf['pop_map'] = [asset_population_map[x] for x in voronoi_gdf['asset_id']]
c:\Users\peregrin\AppData\Local\miniforge3\envs\miraca_template\Lib\site-packages\pyogrio\raw.py:198: RuntimeWarning: driver GeoJSON does not support open option DRIVER
  return ogr_read(
C:\Users\peregrin\AppData\Local\Temp\ipykernel_29288\3309938487.py:14: DeprecationWarning: The 'unary_union' attribute is deprecated, use the 'union_all()' method instead.
  boundary=study_area.geometry.unary_union
c:\Users\peregrin\AppData\Local\miniforge3\envs\miraca_template\Lib\site-packages\pyogrio\raw.py:198: RuntimeWarning: driver GPKG does not support open option DRIVER
  return ogr_read(
Creating Voronoi polygons for service areas...
Loading population data...
Preparing population impact data...
Population assignment: 221/229 polygons with impact values
Total assigned population: 41969
Population data prepared for 229 assets
Then, the same is done for Values of Lost Load per land use:
# Try to load pre-computed asset_to_lu
if asset_to_lu_cache_path.exists():
    print(f"Loading asset_to_lu from cache: {asset_to_lu_cache_path}")
    with open(asset_to_lu_cache_path, 'rb') as f:
        asset_to_lu = pickle.load(f)
    print(f"Loaded asset_to_lu for {len(asset_to_lu)} assets from cache")

    asset_land_use_map = {
        aid: {lu_type: area for lu_type, area, voll_rate in lu_entries}
        for aid, lu_entries in asset_to_lu.items()
    }

else:
    print("Computing asset_to_lu from scratch...")

    # Load land use data
    land_use_data = gpd.read_file(land_use_path, driver='GPKG')

    # Calculate VOLL rates (populates VOLL_PER_SQM)
    consumption_per_sqm, voll_per_sqm = update_voll_rates(land_use_data)
    print(f"VOLL rates calculated for {len(voll_per_sqm)} categories")

    # Compute asset-land use intersections (the expensive operation)
    asset_land_use_map = prepare_land_use_impact_data(
        land_use_data,
        voronoi_gdf=voronoi_polygons_by_type['msls']
    )
    print(f"Computed intersections for {len(asset_land_use_map)} assets")

    # Build asset_to_lu with VOLL rates included
    asset_to_lu = {}
    for aid, lu_dict in asset_land_use_map.items():
        asset_to_lu[aid] = [(lu_type, area, voll_per_sqm[lu_type])
                             for lu_type, area in lu_dict.items()
                             if lu_type in voll_per_sqm]

    # Cache the complete lookup
    with open(asset_to_lu_cache_path, 'wb') as f:
        pickle.dump(asset_to_lu, f)
    print(f"Saved asset_to_lu to cache: {asset_to_lu_cache_path}")

# Output
print(f"\nasset_to_lu ready with {len(asset_to_lu)} assets")
Computing asset_to_lu from scratch...
Consumption per square meter by land use [MWh/h/m²]:
  commercial: 0.0023797518
  industrial: 0.0066238837
  public_sector: 0.0024542763
  transport: 0.0010109956
  residential: 0.0035054641
  other: 0.0000023999

VOLL per square meter by land use [€/h/m²]:
  commercial: 202.115201
  industrial: 511.113373
  public_sector: 246.235459
  transport: 107.078586
  residential: 121.293896
  other: 0.000002
VOLL rates calculated for 6 categories
Consumption per square meter by land use [MWh/h/m²]:
  commercial: 0.0023797518
  industrial: 0.0066238837
  public_sector: 0.0024542763
  transport: 0.0010109956
  residential: 0.0035054641
  other: 0.0000023999

VOLL per square meter by land use [€/h/m²]:
  commercial: 202.115201
  industrial: 511.113373
  public_sector: 246.235459
  transport: 107.078586
  residential: 121.293896
  other: 0.000002
c:\Users\peregrin\AppData\Local\miniforge3\envs\miraca_template\Lib\site-packages\pyogrio\raw.py:198: RuntimeWarning: driver GPKG does not support open option DRIVER
  return ogr_read(
Computed intersections for 229 assets
Saved asset_to_lu to cache: c:\repos\UC3\data\interim\interim_test_hazard_timesteps\CBS_Publicatiebestand_BBG2017_v1_sample_asset_to_lu.pkl

asset_to_lu ready with 229 assets
Now we visualise the data:
plot_population_and_landuse(
    population_above_0,
    sizes=population_above_0['aantal_inwoners'] / 10,
    voronoi_gdf=voronoi_gdf,
    gdf_assets=gdf_assets,
    asset_land_use_map=asset_land_use_map,
)

voronoi_gdf.to_file(config['interim_dir'] / 'voronoi_service_areas.geojson', driver='GeoJSON')
gdf_assets.to_file(config['interim_dir'] / 'assets_with_voronoi.geojson', driver='GeoJSON')
Land Use Visualization Statistics:
  Total voronoi polygons: 229
  Assets with land use data: 227
  Assets without land use data: 2
  Assets not in mapping: 0
  Total in asset_land_use_map: 229
7. Adaptation#
There are multiple uncertainty sources that should be accounted for:
How many repair crews are there actually available?
What is the maintenance condition of the substations and how does that affect their probability of breakdown?
And perhaps most importantly, what adaptation measures can we adopt in this case?
As an operational measure, different repair schemes are considered, for example, prioritising repairs for substations that service the most population, or those that service the areas of highest monetary impacts.
We identify two structural adaptation options:
Elevating substations
Increasing drainage for certain areas to reduce the inundation depth
In both cases, the depth of water that the adaptation measure reduces is subtracted from the affected assets. In the case of increasing drainage, the effect on both, substations and roads is considered.
We use the Exploratory Modelling Analysis (EMA) workbench for this process: quaquel/EMAworkbench
Kwakkel, J. H. (2017). The Exploratory Modeling Workbench: An open source toolkit for exploratory modeling, scenario discovery, and (multi-objective) robust decision making. Environmental Modelling & Software, 96, 239–250. https://doi.org/10.1016/j.envsoft.2017.06.054
Important
The ‘simulate_asset_damage_recovery_access_breakdown_ema’ function is a wrapper for the ‘simulate_asset_damage_recovery_access_breakdown’ function used in the single assessment run earlier. It is designed to be passed as the function keyword argument for the Model class of the EMA workbench as shown below.
For this cell, expect long runtimes for larger number of scenarios.
ema_logging.log_to_stderr(ema_logging.INFO)

# Load caches
caches = load_simulation_caches(config['interim_dir'], config['hazard_dir'])
print(f"Loaded caches: {[k for k in caches.keys() if caches[k] is not None]}")

max_days = None
execution_id = int(time.time())

# Set up EMA model
model = Model('ElectricitySimulation', function=simulate_asset_damage_recovery_access_breakdown_ema)

model.uncertainties = [
    IntegerParameter('number_repair_crews', 1, 5),
    RealParameter('fragility_param_k', 5.0, 7.5)
]

keep_3d_vars = []  # No per-asset arrays
keep_2d_vars = ['flooded', 'operational', 'damage_ratio', 'repair_time']  # Aggregated

model.constants = [
    Constant('flood_threshold', 0.2),
    Constant('gdf_assets', gdf_assets),
    Constant('hazard_maps', hazard_maps[:max_days]),
    Constant('recovery_parameters', config['recovery_parameters']),
    Constant('root_dir', config['root_dir']),
    Constant('verbose', False),
    Constant('timestep_output', True),
    Constant('execution_id', execution_id),
    Constant('config', config),
    Constant('major_timestep', 24),
    # Cache parameters
    Constant('accessibility_cache', caches.get('accessibility_cache')),
    Constant('hazard_extraction_cache', caches.get('hazard_extraction_cache')),
    Constant('overlap_cache', caches.get('overlap_cache')),
    Constant('island_cache', caches.get('island_cache')),
    # Impact data
    Constant('asset_population_map', asset_population_map),
    Constant('asset_to_lu', asset_to_lu),
    # Dimensionality control
    Constant('keep_3d_vars', []),  #
    Constant('keep_2d_vars', ['flooded', 'operational', 'damage_ratio', 'repair_time'])
]

# Build outcomes list
outcomes_list = []

# Add 3D outcomes (none in this case)
for var in keep_3d_vars:
    outcomes_list.append(TimeSeriesOutcome(var))

# Add 2D outcomes (aggregated across assets)
for var in keep_2d_vars:
    outcomes_list.append(TimeSeriesOutcome(var))

# Add mandatory 1D outcomes (always present)
outcomes_list.extend([
    TimeSeriesOutcome('timesteps'),
    # Population impact outcomes
    TimeSeriesOutcome('affected_population'),
    TimeSeriesOutcome('served_population'),
    TimeSeriesOutcome('affected_population_ratio'),
    # Monetary impacts
    TimeSeriesOutcome('monetary_impact_total'),
    TimeSeriesOutcome('monetary_impact_residential'),
    TimeSeriesOutcome('monetary_impact_commercial'),
    TimeSeriesOutcome('monetary_impact_industrial'),
    TimeSeriesOutcome('monetary_impact_transport'),
    TimeSeriesOutcome('monetary_impact_public_sector'),
])

model.outcomes = outcomes_list

# Set up policies
l1_pumping_area = root_dir / 'data' / 'test_samples' / 'adaptation' / 'l1_adapt_polygon.geojson'
l2_asset_barriers = root_dir / 'data' / 'test_samples' / 'adaptation' / 'l2_adapt_polygon.geojson'


policies = [
    Policy('population_impacts_policy', repair_crew_assignment_method='population impacts islands'),
    Policy('monetary_impacts_policy', repair_crew_assignment_method='monetary impacts islands'),
    Policy('lowest_repair_time_islands_policy', repair_crew_assignment_method='lowest repair time islands'),
    Policy('highest_repair_time_islands_policy', repair_crew_assignment_method='highest repair time islands'),

    # Adaptation
    Policy('baseline',
           repair_crew_assignment_method='monetary impacts islands'),

    Policy('L1_area_pumping + monetary',
           repair_crew_assignment_method='monetary impacts islands',
           l1_area_geojson=str(l1_pumping_area),
           l1_active_timesteps=list(range(24, 165))),

    Policy('L2_asset_protection + monetary',
           repair_crew_assignment_method='monetary impacts islands',
           l2_asset_geojson=str(l2_asset_barriers),
           l2_active_timesteps=list(range(0, 240))),

    Policy('L1_and_L2_combined + monetary',
           repair_crew_assignment_method='monetary impacts islands',
           l1_area_geojson=str(l1_pumping_area),
           l1_active_timesteps=list(range(24, 165)),
           l2_asset_geojson=str(l2_asset_barriers),
           l2_active_timesteps=list(range(0, 240))),
]

with SequentialEvaluator(model) as evaluator:
    experiments, outcomes = evaluator.perform_experiments(
        scenarios=50,
        policies=policies,
        uncertainty_sampling=Samplers.LHS
    )

experiments_df = pd.DataFrame(experiments)
print(f"\nCompleted all experiments with execution id {execution_id}. Total runs: {len(experiments)}")
[MainProcess/INFO] performing 50 scenarios * 8 policies * 1 model(s) = 400 experiments
Loading simulation caches...
No accessibility cache found at c:\repos\UC3\data\interim\interim_test_hazard_timesteps\accessibility_cache_test_hazard_timesteps.pkl
Loaded hazard extraction cache: 10 entries from c:\repos\UC3\data\interim\interim_test_hazard_timesteps\hazard_extraction_cache_test_hazard_timesteps.pkl
Loaded overlap cache: 9 entries from c:\repos\UC3\data\interim\interim_test_hazard_timesteps\overlap_cache_test_hazard_timesteps.pkl
Loaded island cache: 10 entries from c:\repos\UC3\data\interim\interim_test_hazard_timesteps\island_cache_test_hazard_timesteps.pkl
Loaded caches: ['accessibility_cache', 'hazard_extraction_cache', 'overlap_cache', 'island_cache']
  0%|                                                  | 0/400 [00:00<?, ?it/s][MainProcess/INFO] performing experiments sequentially
 62%|█████████████████████████               | 250/400 [00:26<00:14, 10.15it/s]
Cache miss for island_assignment_EV0_ma_0.2_n245_ffb9075134a2efe7ad5cdcebb95eef31_L1f5bd4d04, computing islands on the fly...
Loading hazard graph from c:\repos\UC3\data\test_samples\static\output_graph\base_graph_hazard_editted.p
Saved island cache: 11 entries to c:\repos\UC3\data\interim\interim_test_hazard_timesteps\island_cache_test_hazard_timesteps.pkl
Successfully computed and cached islands for island_assignment_EV0_ma_0.2_n245_ffb9075134a2efe7ad5cdcebb95eef31_L1f5bd4d04
Cache miss for island_assignment_EV1_ma_0.2_n245_ffb9075134a2efe7ad5cdcebb95eef31_L1f5bd4d04, computing islands on the fly...
Loading hazard graph from c:\repos\UC3\data\test_samples\static\output_graph\base_graph_hazard_editted.p
Saved island cache: 12 entries to c:\repos\UC3\data\interim\interim_test_hazard_timesteps\island_cache_test_hazard_timesteps.pkl
Successfully computed and cached islands for island_assignment_EV1_ma_0.2_n245_ffb9075134a2efe7ad5cdcebb95eef31_L1f5bd4d04
Computing island lengths...
Saved overlap cache: 10 entries to c:\repos\UC3\data\interim\interim_test_hazard_timesteps\overlap_cache_test_hazard_timesteps.pkl
Cache miss for island_assignment_EV2_ma_0.2_n245_ffb9075134a2efe7ad5cdcebb95eef31_L1f5bd4d04, computing islands on the fly...
Loading hazard graph from c:\repos\UC3\data\test_samples\static\output_graph\base_graph_hazard_editted.p
Saved island cache: 13 entries to c:\repos\UC3\data\interim\interim_test_hazard_timesteps\island_cache_test_hazard_timesteps.pkl
Successfully computed and cached islands for island_assignment_EV2_ma_0.2_n245_ffb9075134a2efe7ad5cdcebb95eef31_L1f5bd4d04
Computing island lengths...
Saved overlap cache: 11 entries to c:\repos\UC3\data\interim\interim_test_hazard_timesteps\overlap_cache_test_hazard_timesteps.pkl
Cache miss for island_assignment_EV3_ma_0.2_n245_ffb9075134a2efe7ad5cdcebb95eef31_L1f5bd4d04, computing islands on the fly...
Loading hazard graph from c:\repos\UC3\data\test_samples\static\output_graph\base_graph_hazard_editted.p
Saved island cache: 14 entries to c:\repos\UC3\data\interim\interim_test_hazard_timesteps\island_cache_test_hazard_timesteps.pkl
Successfully computed and cached islands for island_assignment_EV3_ma_0.2_n245_ffb9075134a2efe7ad5cdcebb95eef31_L1f5bd4d04
Computing island lengths...
Saved overlap cache: 12 entries to c:\repos\UC3\data\interim\interim_test_hazard_timesteps\overlap_cache_test_hazard_timesteps.pkl
Cache miss for island_assignment_EV4_ma_0.2_n245_ffb9075134a2efe7ad5cdcebb95eef31_L1f5bd4d04, computing islands on the fly...
Loading hazard graph from c:\repos\UC3\data\test_samples\static\output_graph\base_graph_hazard_editted.p
Saved island cache: 15 entries to c:\repos\UC3\data\interim\interim_test_hazard_timesteps\island_cache_test_hazard_timesteps.pkl
Successfully computed and cached islands for island_assignment_EV4_ma_0.2_n245_ffb9075134a2efe7ad5cdcebb95eef31_L1f5bd4d04
Computing island lengths...
Saved overlap cache: 13 entries to c:\repos\UC3\data\interim\interim_test_hazard_timesteps\overlap_cache_test_hazard_timesteps.pkl
Cache miss for island_assignment_EV5_ma_0.2_n245_ffb9075134a2efe7ad5cdcebb95eef31_L1f5bd4d04, computing islands on the fly...
Loading hazard graph from c:\repos\UC3\data\test_samples\static\output_graph\base_graph_hazard_editted.p
Saved island cache: 16 entries to c:\repos\UC3\data\interim\interim_test_hazard_timesteps\island_cache_test_hazard_timesteps.pkl
Successfully computed and cached islands for island_assignment_EV5_ma_0.2_n245_ffb9075134a2efe7ad5cdcebb95eef31_L1f5bd4d04
Computing island lengths...
Saved overlap cache: 14 entries to c:\repos\UC3\data\interim\interim_test_hazard_timesteps\overlap_cache_test_hazard_timesteps.pkl
Cache miss for island_assignment_EV6_ma_0.2_n245_ffb9075134a2efe7ad5cdcebb95eef31_L1f5bd4d04, computing islands on the fly...
Loading hazard graph from c:\repos\UC3\data\test_samples\static\output_graph\base_graph_hazard_editted.p
Saved island cache: 17 entries to c:\repos\UC3\data\interim\interim_test_hazard_timesteps\island_cache_test_hazard_timesteps.pkl
Successfully computed and cached islands for island_assignment_EV6_ma_0.2_n245_ffb9075134a2efe7ad5cdcebb95eef31_L1f5bd4d04
Computing island lengths...
Saved overlap cache: 15 entries to c:\repos\UC3\data\interim\interim_test_hazard_timesteps\overlap_cache_test_hazard_timesteps.pkl
Cache miss for island_assignment_EV7_ma_0.2_n245_ffb9075134a2efe7ad5cdcebb95eef31_L1f5bd4d04, computing islands on the fly...
Loading hazard graph from c:\repos\UC3\data\test_samples\static\output_graph\base_graph_hazard_editted.p
Saved island cache: 18 entries to c:\repos\UC3\data\interim\interim_test_hazard_timesteps\island_cache_test_hazard_timesteps.pkl
Successfully computed and cached islands for island_assignment_EV7_ma_0.2_n245_ffb9075134a2efe7ad5cdcebb95eef31_L1f5bd4d04
Computing island lengths...
Saved overlap cache: 16 entries to c:\repos\UC3\data\interim\interim_test_hazard_timesteps\overlap_cache_test_hazard_timesteps.pkl
Cache miss for island_assignment_EV8_ma_0.2_n245_ffb9075134a2efe7ad5cdcebb95eef31_L1f5bd4d04, computing islands on the fly...
Loading hazard graph from c:\repos\UC3\data\test_samples\static\output_graph\base_graph_hazard_editted.p
Saved island cache: 19 entries to c:\repos\UC3\data\interim\interim_test_hazard_timesteps\island_cache_test_hazard_timesteps.pkl
Successfully computed and cached islands for island_assignment_EV8_ma_0.2_n245_ffb9075134a2efe7ad5cdcebb95eef31_L1f5bd4d04
Computing island lengths...
Saved overlap cache: 17 entries to c:\repos\UC3\data\interim\interim_test_hazard_timesteps\overlap_cache_test_hazard_timesteps.pkl
Cache miss for island_assignment_EV9_ma_0.2_n245_ffb9075134a2efe7ad5cdcebb95eef31_L1f5bd4d04, computing islands on the fly...
Loading hazard graph from c:\repos\UC3\data\test_samples\static\output_graph\base_graph_hazard_editted.p
Saved island cache: 20 entries to c:\repos\UC3\data\interim\interim_test_hazard_timesteps\island_cache_test_hazard_timesteps.pkl
Successfully computed and cached islands for island_assignment_EV9_ma_0.2_n245_ffb9075134a2efe7ad5cdcebb95eef31_L1f5bd4d04
Computing island lengths...
Saved overlap cache: 18 entries to c:\repos\UC3\data\interim\interim_test_hazard_timesteps\overlap_cache_test_hazard_timesteps.pkl
100%|████████████████████████████████████████| 400/400 [00:45<00:00,  8.73it/s]
[MainProcess/INFO] experiments finished
Completed all experiments with execution id 1771513793. Total runs: 400
And then we visualise the results:
experiments_df.sort_values(by=['policy', 'scenario'], inplace=True)
print(f"Sample of experiment DataFrame:")
experiments_df.sample(10).sort_index()
Sample of experiment DataFrame:
| fragility_param_k | number_repair_crews | scenario | policy | model | |
|---|---|---|---|---|---|
| 0 | 5.735938 | 2 | 0 | population_impacts_policy | ElectricitySimulation |
| 121 | 6.275224 | 1 | 21 | lowest_repair_time_islands_policy | ElectricitySimulation |
| 130 | 5.011044 | 4 | 30 | lowest_repair_time_islands_policy | ElectricitySimulation |
| 144 | 5.114600 | 5 | 44 | lowest_repair_time_islands_policy | ElectricitySimulation |
| 177 | 5.782857 | 2 | 27 | highest_repair_time_islands_policy | ElectricitySimulation |
| 189 | 7.050600 | 3 | 39 | highest_repair_time_islands_policy | ElectricitySimulation |
| 247 | 5.165909 | 2 | 47 | baseline | ElectricitySimulation |
| 252 | 6.788225 | 2 | 2 | L1_area_pumping + monetary | ElectricitySimulation |
| 275 | 6.746287 | 4 | 25 | L1_area_pumping + monetary | ElectricitySimulation |
| 299 | 6.964824 | 4 | 49 | L1_area_pumping + monetary | ElectricitySimulation |
8. Comparison of adaptation options#
Here we can see the summary of results for the runs, and the effect each adaptation policy has on the outcomes.
available_outcomes = list(outcomes.keys())

# Categorize outcomes
asset_outcomes_3d = keep_3d_vars
asset_outcomes_2d = keep_2d_vars
population_outcomes = ['affected_population', 'served_population', 'affected_population_ratio']
monetary_outcomes = ['monetary_impact_total', 'monetary_impact_residential',
                    'monetary_impact_commercial', 'monetary_impact_industrial',
                    'monetary_impact_transport', 'monetary_impact_public_sector']

# Select outcomes to plot
outcomes_to_show = []

# Add available asset outcomes (will be aggregated if 3D)
for outcome in asset_outcomes_3d + asset_outcomes_2d:
    if outcome in available_outcomes:
        outcomes_to_show.append(outcome)

# Add population outcomes (already 1D/2D)
for outcome in population_outcomes:
    if outcome in available_outcomes:
        outcomes_to_show.append(outcome)

# Add monetary outcomes (already 1D/2D, cumulative)
for outcome in monetary_outcomes:
    if outcome in available_outcomes:
        outcomes_to_show.append(outcome)

# Aggregate only what needs aggregation
aggregation_info = aggregate_outcomes(outcomes, outcomes_to_show)

print("\nAggregation summary:")
for key, info in aggregation_info.items():
    print(f"  {key}: {info}")
Aggregation summary:
  flooded: already 2D
  operational: already 2D
  damage_ratio: already 2D
  repair_time: already 2D
  affected_population: already 2D
  served_population: already 2D
  affected_population_ratio: already 2D
  monetary_impact_total: already 2D
  monetary_impact_residential: already 2D
  monetary_impact_commercial: already 2D
  monetary_impact_industrial: already 2D
  monetary_impact_transport: already 2D
  monetary_impact_public_sector: already 2D
And plot it using the lines function, part of the EMA workbench.
To explore the different outputs, some grouping and filtering functionalities are prepared.
Warning
Monetary impacts are illustrative unless calculated with country-wide VOLL rates instead of sample data!
# Configure grouping
group_by = "policy"
# Alternative groupings (uncomment to use):
# group_by = "number_repair_crews"
# bin_ranges = [(1, 1),(5, 5)]
# bin_ranges = create_bins(1, 4, bin_size=1)
# group_by = "fragility_param_k"
# bin_ranges = create_float_bins(5.0, 7.5, 0.5)
# Configure filters
var_val = {'number_repair_crews': (2,4), # Example: filter for 2 to 4 repair crews
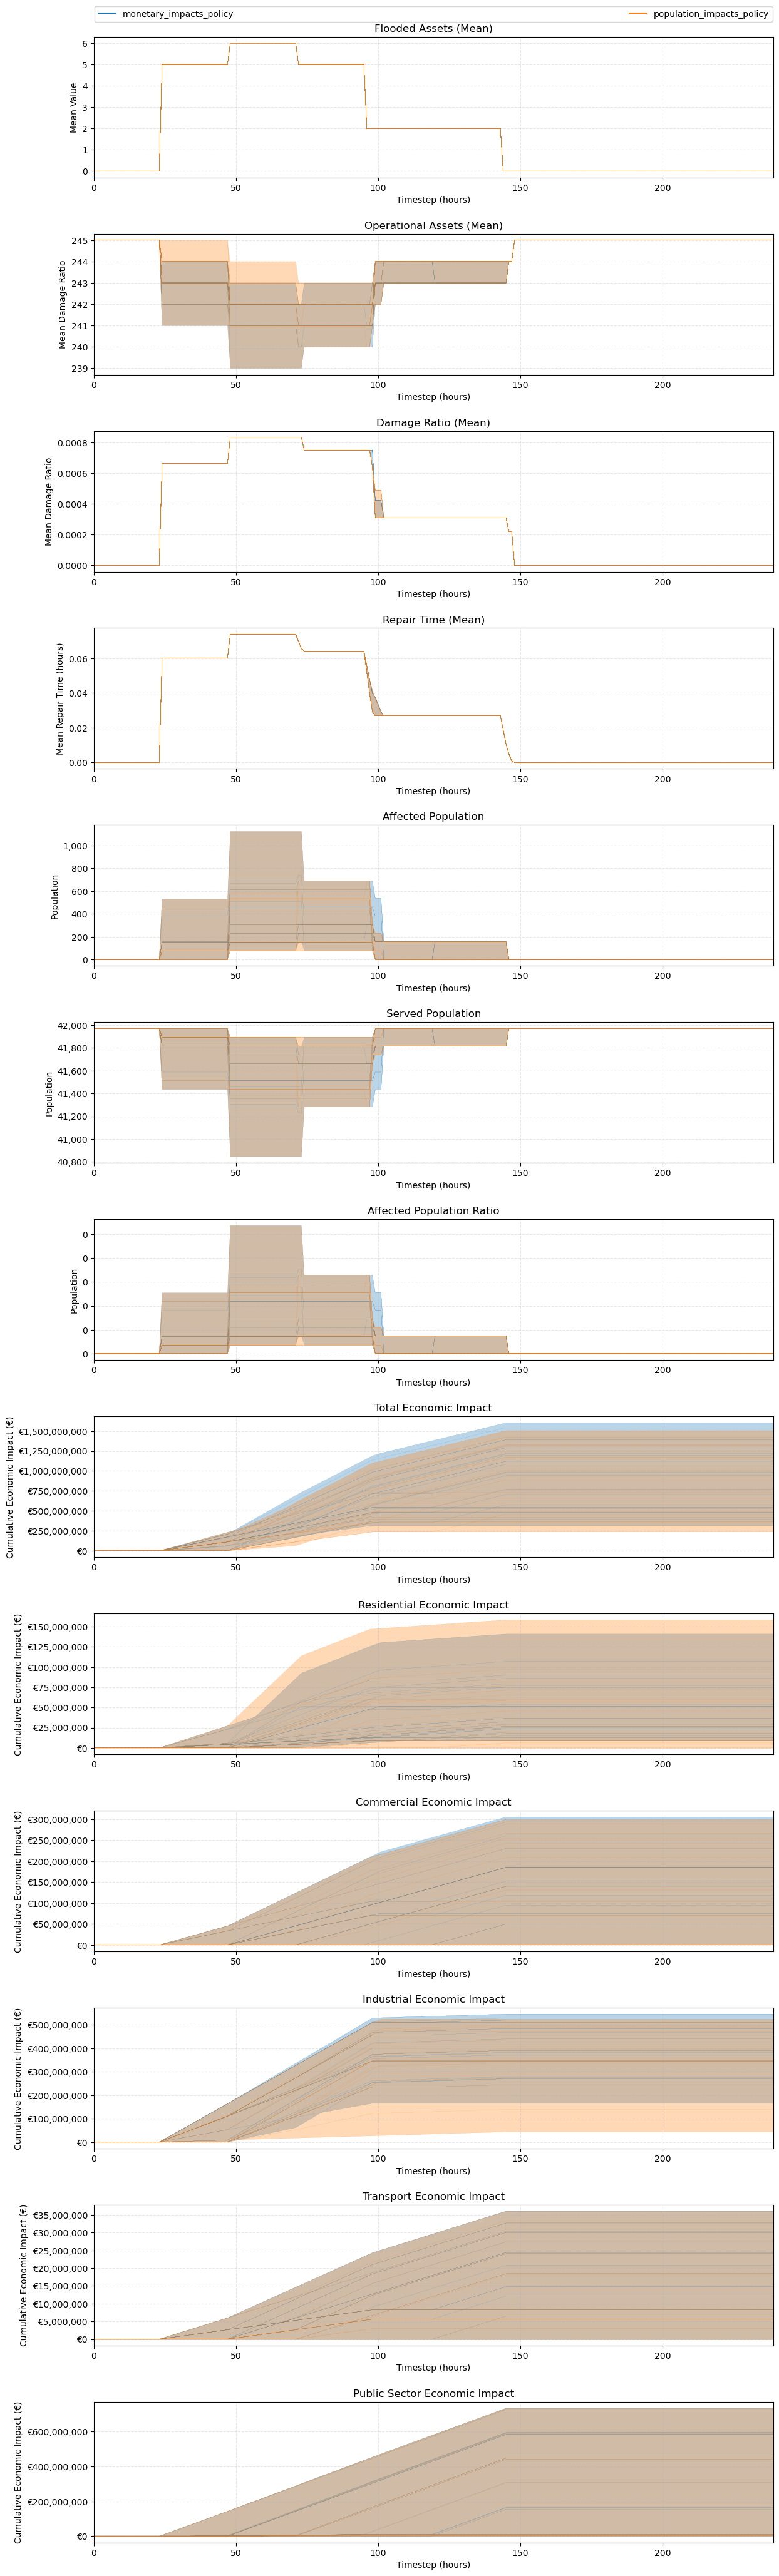
'policy': ['population_impacts_policy', 'monetary_impacts_policy']} # Example: filter for specific policies
# Filter experiments DataFrame for the desired value
experiments_sample = sample_experiments(var_val, experiments_df)
sample_indices = experiments_sample.index.values
# Filter outcomes for these indices
outcomes_for_sample = {k: v[sample_indices] for k, v in outcomes.items()}
plot_grouped_outcomes(
group_by=group_by,
experiments_df=experiments_df,
outcomes=outcomes,
outcomes_to_show=outcomes_to_show,
var_val=var_val,
bin_ranges=None,
monetary_outcomes=monetary_outcomes,
population_outcomes=population_outcomes,
asset_outcomes_3d=asset_outcomes_3d,
asset_outcomes_2d=asset_outcomes_2d,
)
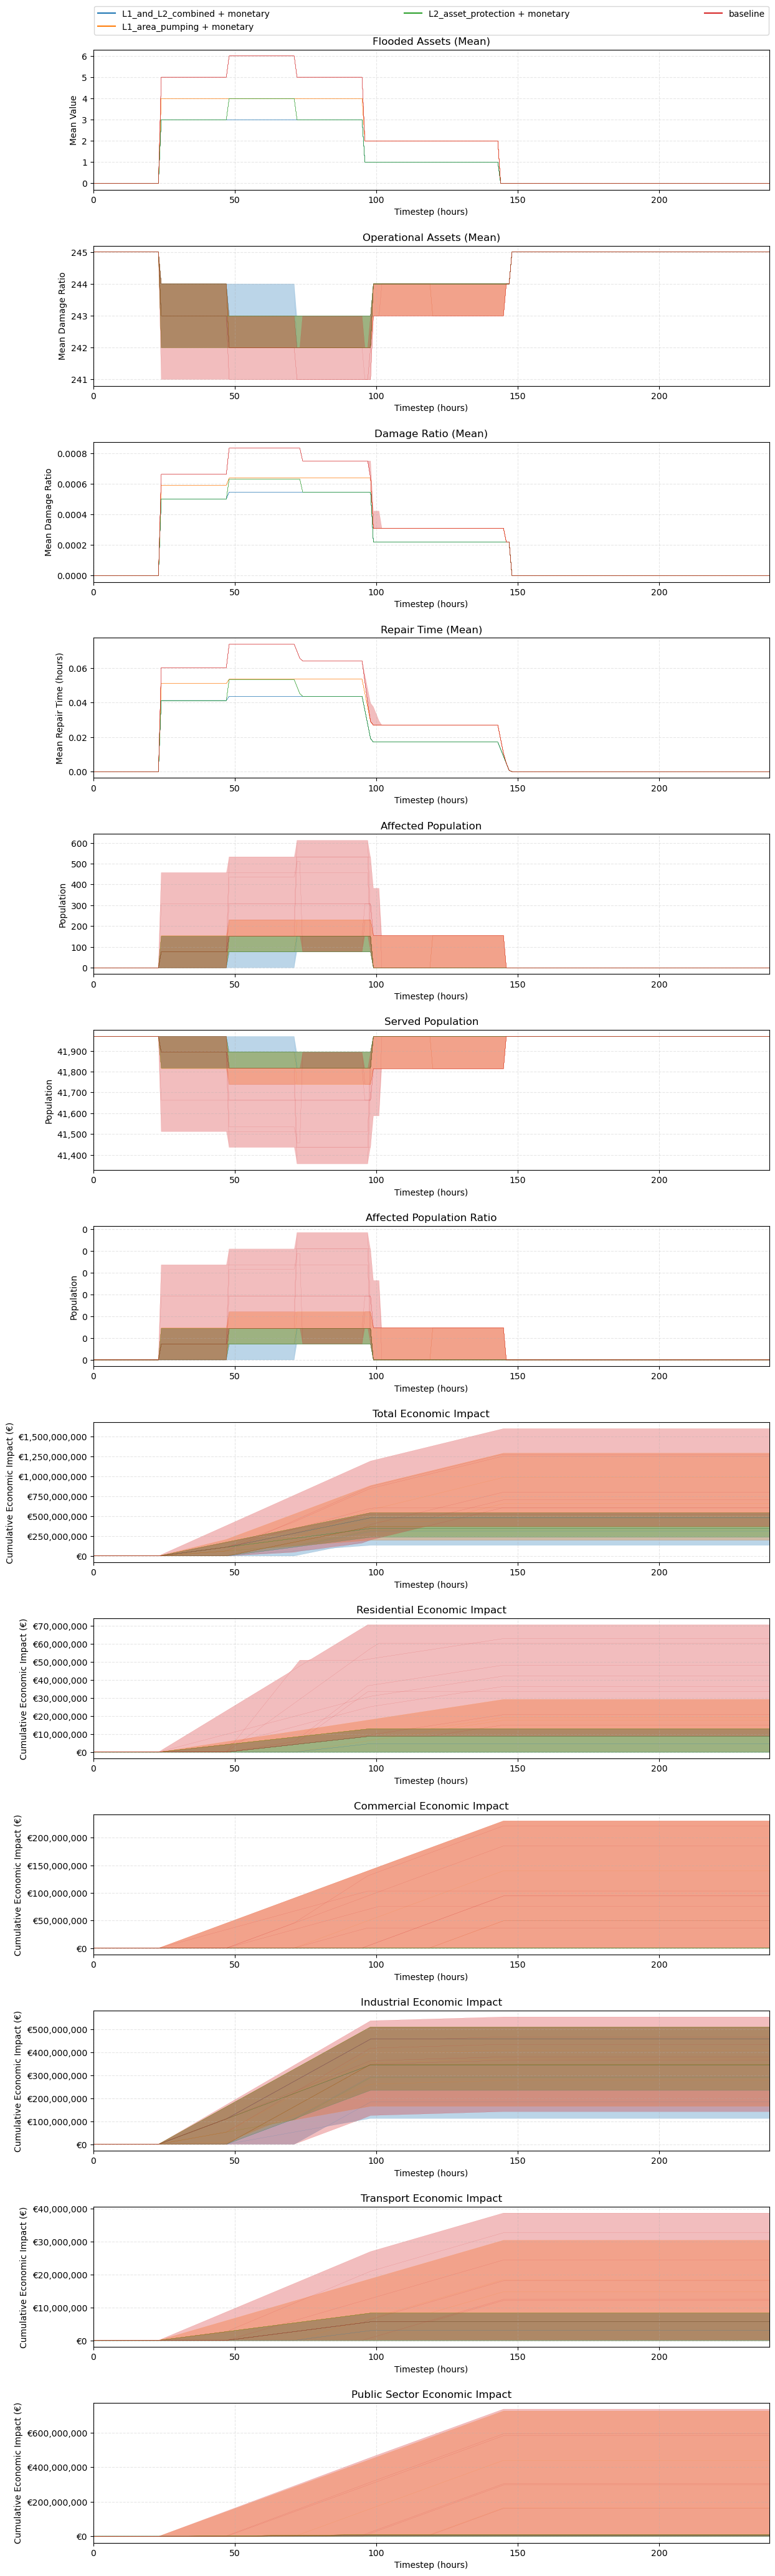
# Configure filters for adaptation policies given a number of repair crews
var_val = {'number_repair_crews': (3,3), # Example: filter for 3 repair crews
'policy': ['baseline', 'L1_area_pumping + monetary', 'L2_asset_protection + monetary', 'L1_and_L2_combined + monetary']} # Example: filter for specific policies
# Filter experiments DataFrame for the desired value
experiments_sample = sample_experiments(var_val, experiments_df)
sample_indices = experiments_sample.index.values
# Filter outcomes for these indices
outcomes_for_sample = {k: v[sample_indices] for k, v in outcomes.items()}
plot_grouped_outcomes(
group_by=group_by,
experiments_df=experiments_df,
outcomes=outcomes,
outcomes_to_show=outcomes_to_show,
var_val=var_val,
bin_ranges=None,
monetary_outcomes=monetary_outcomes,
population_outcomes=population_outcomes,
asset_outcomes_3d=asset_outcomes_3d,
asset_outcomes_2d=asset_outcomes_2d,
)
# Run comparison
experiments_df = pd.DataFrame(experiments)
compare_adaptation_policies(experiments_df, outcomes)
c:\repos\UC3\src\visualization.py:716: UserWarning: Boolean Series key will be reindexed to match DataFrame index.
  return experiments_df[mask]
c:\repos\UC3\src\visualization.py:716: UserWarning: Boolean Series key will be reindexed to match DataFrame index.
  return experiments_df[mask]
Plot summary:

Grouped by: policy
Number of bins: N/A

Outcomes plotted:
  • flooded                                  Asset (2D pre-aggregated)      2D (400 experiments x 240 timesteps)
  • operational                              Asset (2D pre-aggregated)      2D (400 experiments x 240 timesteps)
  • damage_ratio                             Asset (2D pre-aggregated)      2D (400 experiments x 240 timesteps)
  • repair_time                              Asset (2D pre-aggregated)      2D (400 experiments x 240 timesteps)
  • affected_population                      Population                     2D (400 experiments x 240 timesteps)
  • served_population                        Population                     2D (400 experiments x 240 timesteps)
  • affected_population_ratio                Population                     2D (400 experiments x 240 timesteps)
  • monetary_impact_total                    Monetary (cumulative)          2D (400 experiments x 240 timesteps)
  • monetary_impact_residential              Monetary (cumulative)          2D (400 experiments x 240 timesteps)
  • monetary_impact_commercial               Monetary (cumulative)          2D (400 experiments x 240 timesteps)
  • monetary_impact_industrial               Monetary (cumulative)          2D (400 experiments x 240 timesteps)
  • monetary_impact_transport                Monetary (cumulative)          2D (400 experiments x 240 timesteps)
  • monetary_impact_public_sector            Monetary (cumulative)          2D (400 experiments x 240 timesteps)


Monetary impact

monetary_impact_total:
  Shape: (400, 240)
  Min final value: €0.00
  Max final value: €1,774,238,201.05
  Mean final value: €710,685,019.26
  Non-zero scenarios: 397 / 400

monetary_impact_residential:
  Shape: (400, 240)
  Min final value: €0.00
  Max final value: €166,624,547.26
  Mean final value: €30,978,615.54
  Non-zero scenarios: 348 / 400

monetary_impact_commercial:
  Shape: (400, 240)
  Min final value: €0.00
  Max final value: €333,579,933.73
  Mean final value: €80,065,022.59
  Non-zero scenarios: 386 / 400

monetary_impact_industrial:
  Shape: (400, 240)
  Min final value: €0.00
  Max final value: €575,743,197.61
  Mean final value: €386,402,731.03
  Non-zero scenarios: 396 / 400

monetary_impact_transport:
  Shape: (400, 240)
  Min final value: €0.00
  Max final value: €39,142,087.05
  Mean final value: €12,894,435.79
  Non-zero scenarios: 335 / 400

monetary_impact_public_sector:
  Shape: (400, 240)
  Min final value: €0.00
  Max final value: €761,777,071.16
  Mean final value: €200,344,213.90
  Non-zero scenarios: 335 / 400
c:\repos\UC3\src\visualization.py:716: UserWarning: Boolean Series key will be reindexed to match DataFrame index.
  return experiments_df[mask]
c:\repos\UC3\src\visualization.py:716: UserWarning: Boolean Series key will be reindexed to match DataFrame index.
  return experiments_df[mask]
Plot summary:

Grouped by: policy
Number of bins: N/A

Outcomes plotted:
  • flooded                                  Asset (2D pre-aggregated)      2D (400 experiments x 240 timesteps)
  • operational                              Asset (2D pre-aggregated)      2D (400 experiments x 240 timesteps)
  • damage_ratio                             Asset (2D pre-aggregated)      2D (400 experiments x 240 timesteps)
  • repair_time                              Asset (2D pre-aggregated)      2D (400 experiments x 240 timesteps)
  • affected_population                      Population                     2D (400 experiments x 240 timesteps)
  • served_population                        Population                     2D (400 experiments x 240 timesteps)
  • affected_population_ratio                Population                     2D (400 experiments x 240 timesteps)
  • monetary_impact_total                    Monetary (cumulative)          2D (400 experiments x 240 timesteps)
  • monetary_impact_residential              Monetary (cumulative)          2D (400 experiments x 240 timesteps)
  • monetary_impact_commercial               Monetary (cumulative)          2D (400 experiments x 240 timesteps)
  • monetary_impact_industrial               Monetary (cumulative)          2D (400 experiments x 240 timesteps)
  • monetary_impact_transport                Monetary (cumulative)          2D (400 experiments x 240 timesteps)
  • monetary_impact_public_sector            Monetary (cumulative)          2D (400 experiments x 240 timesteps)


Monetary impact

monetary_impact_total:
  Shape: (400, 240)
  Min final value: €0.00
  Max final value: €1,774,238,201.05
  Mean final value: €710,685,019.26
  Non-zero scenarios: 397 / 400

monetary_impact_residential:
  Shape: (400, 240)
  Min final value: €0.00
  Max final value: €166,624,547.26
  Mean final value: €30,978,615.54
  Non-zero scenarios: 348 / 400

monetary_impact_commercial:
  Shape: (400, 240)
  Min final value: €0.00
  Max final value: €333,579,933.73
  Mean final value: €80,065,022.59
  Non-zero scenarios: 386 / 400

monetary_impact_industrial:
  Shape: (400, 240)
  Min final value: €0.00
  Max final value: €575,743,197.61
  Mean final value: €386,402,731.03
  Non-zero scenarios: 396 / 400

monetary_impact_transport:
  Shape: (400, 240)
  Min final value: €0.00
  Max final value: €39,142,087.05
  Mean final value: €12,894,435.79
  Non-zero scenarios: 335 / 400

monetary_impact_public_sector:
  Shape: (400, 240)
  Min final value: €0.00
  Max final value: €761,777,071.16
  Mean final value: €200,344,213.90
  Non-zero scenarios: 335 / 400
Impact results - all experiments (n=400):
Number of policies: 8

Monetary Impact Total:
  - Peak hourly impact: €20,221,026.68
  - Total impact (mean): €710,685,019.26
  - Total impact (median): €543,323,380.59

Monetary Impact Residential:
  - Peak hourly impact: €3,333,248.44
  - Total impact (mean): €30,978,615.54
  - Total impact (median): €17,730,402.20

Monetary Impact Commercial:
  - Peak hourly impact: €3,284,463.09
  - Total impact (mean): €80,065,022.59
  - Total impact (median): €36,593,992.05

Monetary Impact Industrial:
  - Peak hourly impact: €7,163,561.93
  - Total impact (mean): €386,402,731.03
  - Total impact (median): €400,066,560.26

Monetary Impact Transport:
  - Peak hourly impact: €359,786.73
  - Total impact (mean): €12,894,435.79
  - Total impact (median): €8,288,186.39

Monetary Impact Public Sector:
  - Peak hourly impact: €6,079,966.49
  - Total impact (mean): €200,344,213.90
  - Total impact (median): €10,811,117.38


Adaptation Policy Comparison
  population_impacts_policy: €748,916,283.92 (±€410,274,979.14)
  monetary_impacts_policy: €945,556,224.43 (±€415,724,442.17)
  lowest_repair_time_islands_policy: €798,108,529.18 (±€443,069,373.38)
  highest_repair_time_islands_policy: €747,329,936.46 (±€459,319,699.14)
  baseline: €885,626,598.46 (±€420,950,333.78)
  L1_area_pumping + monetary: €778,442,355.40 (±€410,482,993.01)
  L2_asset_protection + monetary: €402,939,653.94 (±€115,492,603.07)
  L1_and_L2_combined + monetary: €378,560,572.27 (±€142,160,318.60)

Detailed results for policy: population_impacts_policy
-- population_impacts_policy (n=50):
  Total monetary impact: €748,916,283.92 (±€410,274,979.14)
  Peak flooded assets: 6.0
  Min operational assets: 241.5
  Peak affected population: 342

Detailed results for policy: monetary_impacts_policy
-- monetary_impacts_policy (n=50):
  Total monetary impact: €945,556,224.43 (±€415,724,442.17)
  Peak flooded assets: 6.0
  Min operational assets: 241.3
  Peak affected population: 389

Detailed results for policy: lowest_repair_time_islands_policy
-- lowest_repair_time_islands_policy (n=50):
  Total monetary impact: €798,108,529.18 (±€443,069,373.38)
  Peak flooded assets: 6.0
  Min operational assets: 241.4
  Peak affected population: 377

Detailed results for policy: highest_repair_time_islands_policy
-- highest_repair_time_islands_policy (n=50):
  Total monetary impact: €747,329,936.46 (±€459,319,699.14)
  Peak flooded assets: 6.0
  Min operational assets: 241.5
  Peak affected population: 389

Detailed results for policy: baseline
-- baseline (n=50):
  Total monetary impact: €885,626,598.46 (±€420,950,333.78)
  Peak flooded assets: 6.0
  Min operational assets: 241.3
  Peak affected population: 394

Detailed results for policy: L1_area_pumping + monetary
-- L1_area_pumping + monetary (n=50):
  Total monetary impact: €778,442,355.40 (±€410,482,993.01)
  Peak flooded assets: 4.0
  Min operational assets: 241.9
  Peak affected population: 200

Detailed results for policy: L2_asset_protection + monetary
-- L2_asset_protection + monetary (n=50):
  Total monetary impact: €402,939,653.94 (±€115,492,603.07)
  Peak flooded assets: 4.0
  Min operational assets: 242.2
  Peak affected population: 162

Detailed results for policy: L1_and_L2_combined + monetary
-- L1_and_L2_combined + monetary (n=50):
  Total monetary impact: €378,560,572.27 (±€142,160,318.60)
  Peak flooded assets: 3.0
  Min operational assets: 242.3
  Peak affected population: 126
9. References#
FEMA. Multi-Hazard Loss Estimation Methodology, Flood Model: Hazus-MH MR4 Technical Manual, 2009th ed.; FEMA: Washington, DC, USA, 2009.
Movahednia, M., Kargarian, A., Ozdemir, C. E., & Hagen, S. C. (2022). Power Grid Resilience Enhancement via Protecting Electrical Substations Against Flood Hazards: A Stochastic Framework. IEEE Transactions on Industrial Informatics, 18(3), 2132–2143. https://doi.org/10.1109/TII.2021.3100079
Sánchez-Muñoz, D., Domínguez-García, J. L., Martínez-Gomariz, E., Russo, B., Stevens, J., & Pardo, M. (2020). Electrical Grid Risk Assessment Against Flooding in Barcelona and Bristol Cities. Sustainability, 12(4), 1527. https://doi.org/10.3390/su12041527